Results of the Discipleship Model
The aim of this model is to understand the growth in maturity of church members from conversion to leadership through a discipleship process. There are 6 basic categories of people: unbelievers, potential converts, basic discipleship, early mature, mature, inactive. The last 4 constitute the believing church, though potential believers may also attend.
Principles can be established for church growth where there are believers at different stages of discipleship:
- Constant conversion rate limits church growth.
- Balance of maturity among believers depends on progression alone.
- Static and dynamic perceptions of church maturity are often contradictory.
- Transfer growth masks a poor discipleship process.
- Healthy maturity balance requires a robust discipleship process.
Constant Conversion Rate Limits Church Growth
A simple example will suffice to demonstrate this result. Let a church see 10 new converts a year, but lose 10% of its total each year. Whatever the initial number in the church, it will eventually end with 100. This is the point where the number leaving (10% church) is equal to the number joining. It cannot grow any more. The equilibrium depends solely on the number of converts per year and the loss rate. Additionally, the time taken to reach that equilibrium value will depend on how far the church numbers start from that value.
A similar effect occurs in the Discipleship model. Regardless of the number of categories of people in the chain (4 in this version), or the number of drop-out points, an equilibrium will be reached which depends purely on the rate at which people start attending church and the rate of losses. An example of growth to equilibrium is shown in figure 1.

Balance of Maturity in the Church is Determined by Progression in Discipleship Alone
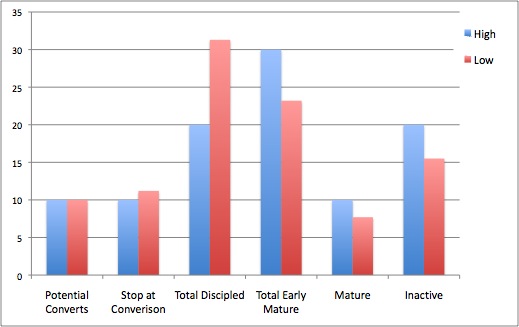
The number in each discipleship category will be limited, as it is for the whole church. Thus, Basic Discipleship, Early Mature, Mature and Inactive will each tend to their own equilibrium limits. The proportion in each category is fixed by the way people progress through the discipleship system. For example, in figure 2, the blue bars are the equilibrium numbers in each category when about 75% of those in basic discipleship progress to early mature. The red bars are the same system with that progression reduced to 50%. The value of these progression fractions determines the equilibrium number in each category. Change just one number and the balance changes.
Apart from the significant drop in the early mature category, also notice the fall in the mature and inactive categories, and rise in the earlier categories. One progression fraction affects the whole system and, if insufficient, can act as a bottleneck leaving a church with insufficient mature believers.
Likewise changing the duration in a category can also affect the balance in each category. In figure 3, the blue and red bars show the equilibrium numbers when the time spent in basic discipleship is just under 3 years, and 5 years, respectively. The increased number in basic discipleship forces a drop in all the other categories, earlier as well as later. Thus a church that keeps people too long at one discipleship stage does so to the detriment of the other stages.

The progression fractions and durations determine how many people are in each category in equilibrium. Churches are rarely in equilibrium, and at any time the actual numbers in each category may be different from that determined by progression fractions and durations in each category. For example, a church may find it has more mature and early mature to that predicted by the fractions and durations, however, unless it attends to these fractions and durations its numbers in the mature categories will decline. For good health, a church needs to look to the processes taking place not just to its numbers.
Static and Dynamic Perceptions of Church Maturity are Often Contradictory.
The static perception of the church refers to the number of people who belong at a given time, and how that number breaks down into the various categories. This perception asks questions like “how many people attend each Sunday?” or “how many new converts do you have?” A church may feel it is healthy because it has many people in the mature category. Thus, it perceives its health from a snapshot of what it has.
The dynamic perception of the church refers to the processes taking place that govern change, the fraction that progress from one category to the next and the duration of each process. In summary, the progression in discipleship. It asks questions like “what fraction of new converts eventually become discipled?” or “what is the average length of time people remain early mature before they take on leadership responsibility?” As seen in the previous section. The dynamic processes in the church determine the equilibrium values in each category, the final static numbers.
It is common for the church to hold a static perception of itself that is far from the equilibrium determined by its perception of the dynamic processes. Generally, churches tend to be optimistic in their static view, but more pessimistic in their dynamic outlook. That is, they think they have a better balance of maturity than their view of its progression in discipleship suggests. As the arithmetic is very complex, it is almost impossible for people to check these views and realise they are in contradiction.
For example, one group of people suggested progressions fractions and durations for what they perceived was a typical church (tables 1 & 2).
| Fractions | Percentage |
|---|---|
| fraction new converts who go deeper | 50% |
| fraction take on responsibilities | 50% |
| fraction who become lay leader | 20% |
| fraction who say no | 80% |
| Durations | years |
|---|---|
| time to be open again | 5 |
| time potential convert | 1 |
| time in basic discipleship | 1 |
| time early mature before mature | 5 |
| time mature | 10 |
| time at stopped early mature before inactive | 10 |
Hidden in this dynamic perception are the values of all the categories, the equilibrium static values. The same group of people made an initial guess at those values for a church of 100 people, their static perception of the church. These are indicated in the second column of table 3. It was assumed the church would neither grow nor decline, which gave a loss rate of 0.08 per annum in the categories where losses took place.
The third column in table 3 has the actual equilibrium values based on their dynamic perception, assuming the church is neither declining or growing, requiring a lower loss rate than 8%. The final column has the equilibrium percentages based on their dynamic perception with the original loss rate of 0.08. (In this case, the church is declining so only the percentages are in equilibrium.)
| Category | Initial Guess | Equilibrium values based on tables 1&2 (static church) | Equilibrium percent based on tables 1&2 (declining church) |
|---|---|---|---|
| Potential Converts | 10 | 10 | 24% |
| Basic Discipleship | 10 | 1 | 2% |
| Early Mature | 30 | 3 | 10% |
| Mature | 20 | 1 | 2% |
| Inactive | 20 | 20 | 8% |
| Dipped toe in church | 40 | 89% | |
| Stop at conversion | 10 | 40 | 25% |
| Stop at basic discipleship | 20 | 13% | |
| Stop at Early mature | 4 | 15% |
Clearly, there is a wide discrepancy in the main categories of Basic Discipleship, Early Mature and Mature. For example, the mature category is much lower than 10 in 100, 1 in the static church and 2% in the declining church. The early mature is similarly over-estimated. The predicted value of 3+4 =7 is nowhere near 30 people out of 100. However, in the declining church, the early mature is closer, 10% + 15% = 25%, although the majority will never progress to mature. The reason behind the discrepancy is that the suggested flows do not let enough people progress to the later categories. As such, there is a build-up of people in the earlier categories, especially the “stop at conversion”. The flows have implied that a large number of converts remain immature, far more than the static perception of the church.
Three reasons could lie behind this discrepancy in the two perceptions:
- One or both of the perceptions are incorrect. The static view is often incorrect as people tend to think of an ideal church that they would like rather than what actually exists in the church. Additionally, the categories can be misinterpreted. For example “Mature” doesn’t just mean those who are spiritually mature in the faith, which is hard to define and measure, but those whose maturity is being demonstrated by leadership activity within the church. The later is easier to measure but will exclude people who are deemed mature but are not active. People who assess numbers naturally err on the side of generosity when considering spiritual maturity, believing many to be “wonderful Christians”. But the issue here is not personal piety but the role a person plays in the discipleship process, a mature person “leads” that process, whether formally or informally.
- The dynamic view can be incorrect as it is hard to estimates the fraction in a category who will never progress to the next category. E.g. above it was stated that 20% went on to be lay leader, with the process taking about 5 years of being early mature. Did that imply 80% will never progress? What about those that progress after 20 years? Should not a higher percentage of people progress but with a longer period than 5 years to progress? These are challenging numbers to pin down, though as it turns out increasing the percentage and lengthening the duration does not affect the equilibrium values to any great extent as the one change cancels out the other.
- The two perceptions are correct, but the church is not in equilibrium, and the healthy values in each category will in time decline. The church may be healthy now, but it will not last unless the flows change. The flows needed for healthy values in each category are given below.
- The two perceptions are correct, but there are additional Christians directly transferring into the church in the later categories. This situation is considered next.
Transfer Growth Masks a Poor Discipleship Process
Transfer growth takes place when people who are already Christians move into a local congregation. This can be because people deliberately leave one local church and join another one through personal preference, or it could be due to geographical moves. Thus, depending on their level of spiritual maturity, transferred Christians will bypass one or more stages of the church’s discipleship path skewing the equilibrium numbers in the more mature categories. This effect is excluded from the first version of the discipleship model as it was constructed to explore whether a church could grow numerically and spiritually through conversion alone. However, studies have shown that the bulk of new people added to the church through “conversion” are people who have been brought up in the church. They are the children of believers who have already had a degree of teaching and discipleship. The majority of additions do not come from new unchurched people being converted. (See, for example, Perrin R.D et. al. (1997), Bibby R.W. and Brinkerhoff M.B. (1994). It is perhaps only in times of revival that additions through conversion exceed those through birth.
Because of education and geographical mobility, many of the people brought up in the faith do not remain in the congregation where they started their Christian life. These believers at different stages of maturity and stages of life will find themselves needing to find a new congregation in the locality into which they move. It is hypothesised here that the more interested a Christian is in discipleship, the more likely they are to choose a congregation that enables them to further grow in maturity. Thus they are more likely to choose a church with a good discipleship process and corresponding opportunities for service. They are less likely to choose one which is protective of areas of service or has little interest in discipleship. Also, it is further hypothesised that mature Christians are more likely to choose a church with mature Christians because of the fellowship, and less likely to choose one dominated by immature Christians unless there is a leadership team seeking to change it. Thus there is a selection effect, the more a church favours discipleship, the more it will attract those brought up in the faith who wish to progress. The more mature believers generated, the more mature believers will be attracted to the church. Thus a church with a poor track record in discipleship will be dominated by those who do not wish to progress, making discipleship even harder to achieve, especially as few mature believers will wish to join.
It is suggested that these hypotheses help explain the existence of a smaller number of large congregations which have large numbers of mature Christians even without a sufficiently successful discipleship programme to generate those numbers. It may help explain why people are reporting a disproportionate number of mature and early mature people in their congregations, the static view, given their dynamic view of percentage flow rates and durations.
The above process is summarised in the loops in figure 4. There is one reinforcing loop due to the church becoming increasingly attractive to those seeking to grow, another because the church become increasingly attractive to mature believers, and a third loop because mature believers as well as those seeking discipleship help resource the discipleship process.
Thus successful church growth is possible, and a good balance of mature Christians can be achieved, without a significant number of conversions. The main source of this growth is through those born into the faith transferring from other churches, churches without the attractive feature of a discipleship process. The growth of the few churches is at the expense of the many who may be static or in long term decline.
A Healthy Balance of Maturity Requires a Robust Discipleship Process
The original purpose of the model was to describe the ideal church with a healthy discipleship process, rather than the one that was actually happening in churches. So the question that needs to be asked is “how can a healthy balance of maturity be established in a growing church without transfer growth?” Firstly, the flows of the model were re-calibrated to achieve the ideal stock values of table 2, the initial guesses. Thus the appropriate dynamic perception is sought to give an ideal static perception. This is given in the last column of table 4.
| Fractions | Original % | Re-calibrated to ideal Stocks |
|---|---|---|
| fraction new converts who go deeper | 50% | 79% |
| fraction take on responsibilities | 50% | 72% |
| fraction who become lay leader | 20% | 22% |
| fraction who say no | 80% | 55% |
| Durations | years | |
| time to be open again | 5 | 10 |
| time potential convert | 1 | 1 |
| time in basic discipleship | 1 | 2.9 |
| time early mature before mature | 5 | 9.2 |
| time mature | 10 | 30 |
| time at stopped early mature before inactive | 10 | 6.4 |
Key changes should be noted:
- The time spent as mature believers needs to be long compared with other categories. Thus, the younger the age people are started on the discipleship process, the better. There should be an expectation of a lifetime of service and growth into maturity, i.e. discourage the notion of retirement from being active as a Christian. There should always be sufficient opportunity for mature believers to be able to serve at the level of their maturity and gifts.
- Basic discipleship may well be longer than a year-long course suggests. The re-calibrated model has almost 3 years which may be more realistic and allow for more considered assimilation of Christian basics by people who may have no cultural background in Christianity.
- The conversion of potential converts needs to be significant. Here it is almost a half, up from 20%. Without this, the whole discipleship process is starved of people.
- Additionally, for those who are converted, there needs to be a greater expectation that they will progress and want to go deeper, almost 80% here. This also requires the church to not cut corners in early discipleship and provide sufficient resources to take care of new converts. This could include incorporating the new converts into the full life of the church, its friendships, activities and ministry.
The church outlined above remained stable in numbers given an 8% annual loss rate in the categories where people leave. A high loss rate can be sustained because there are now far fewer people in the “stop” categories. This can be interpreted as fewer people seeking to leave because the church is more meaningful. In fact, in this church, the actual loss of people is also around 8% due to the number of potential converts who drop out.
To see the church grow, then control mechanisms need to be put in place to increase the number of potential converts each year and reduce losses. Clearly in the church simulated above the numbers attracted would need to rise above 10 and the losses drop below 8%.
Additionally, control mechanisms are needed to facilitate the discipleship process. These will depend on the number of mature believers etc., available to influence those earlier in the process. However, whatever processes are in place, the flows, percentages and durations will need to be similar to the last column of table 3 to keep a healthy balance of maturity in the church.