The decline of the Church of England has been well-publicised for many years. Because of the connections between church and state, the future survival of the church is of interest to many agencies, both Christian and otherwise. Any new attendance figures are likely to make mainstream news, with a discussion of the church’s future prospects. Here, I will apply one of my church growth models to the Church of England attendance figures and examine how serious that decline might be. First, let me set the context.
The Christian Church in the UK has been steadily declining for over 50 years. With a total church membership reaching a peak of 10.3 million in 1930, a slow decline followed by a brief recovery through the 1950s. Since 1960 membership has fallen from 9.9 million in 1960 to 5.9 million in 2000 [1]. It was down further to 5.5 million in 2010 [2]. Not surprisingly, the Church of England’s membership has fallen in a similar fashion, from 2.9 million in 1960 to 1.2 million in 2010 [3,4].
Before analysing figures for the Church of England, some comparisons would be useful. Church decline is remarkably slow compared with the decline in membership of other institutions. For example, political parties fare very badly, with the conservative party falling from a high of 2.9 million in 1951, to 1 million in 1990 and to less than 150,000 in 2012 [5,6]. Similar dramatic falls are recorded for other political parties and the Trade Union movement. Church decline is part of a wider decline in commitment in Western society and by no means the worst. So although the Church of England is right to be concerned about its decline, it has been considerably more successful in resisting that decline than non-religious institutions of a similar size.
Questions
This blog seeks to answer two questions: Will the Church of England continue to decline? If so, will it become extinct, or is there any sign of a recovery?
A straight statistical projection would indicate that the Church of England will eventually become extinct. This extinction date is long after most of the other UK mainstream denominations (and well after the major political parties!) But statistical projections only examine data. They do not factor in any theory as to why a church grows or declines. Thus they may miss some underlying reason why the church may not go extinct.
Limited Enthusiasm Model
The approach I have taken is to construct a model based on the theory that church growth is driven by a sub-class of church members, called enthusiasts, who are instrumental in bringing about conversions into the church. The model is then compared with church data in order to estimate model parameters and determine the likely future for the church, assuming the theory is correct [7]. Unbelievers are also split into those who are open to joining the church and those who are hardened to the church.
A key result of this “Limited Enthusiasm” Model is the existence of two thresholds, or tipping points, connected with extinction and revival-growth. These thresholds are compared with the reproduction potential, which measures the ability of enthusiasts to reproduce themselves [8]. If the reproduction potential is under the extinction threshold, the church eventually declines to zero. If it is over the threshold, the church survives. Likewise, if the reproduction potential is over the revival-growth threshold, church growth is rapid, similar to that seen in religious revivals. Both thresholds depend on the birth, death and loss rates. The revival-growth threshold also depends on the current fraction of open unbelievers in the population.
Although some of the model parameters are difficult to determine, the placement of the reproduction potential compared with the thresholds is more robust. Thus it is possible to be more confident of a church’s extinction or survival. Essentially the model is interpreting curvature in the data in terms of the behaviour of enthusiasts. Thus, if the decline is slowing, it may indicate enthusiasts are reproducing themselves enough for the church to survive.
Analysis of Church of England Attendance 1979-2005
Attendance is a much better indicator of participation than membership in the Church of England. The latter is based on an electoral role, which has not always required participation as a reason for inclusion. However, it is only in recent history that attendance figures have been consistently obtained. The methodology for their collection must be consistent over time otherwise, curvature in the data set will be wrongly interpreted.
My earlier publications in church growth were based on the English Church Attendance Surveys conducted by Christian Research under the then leadership of Peter Brierley [9]. By the 1998 attendance survey, the Church of England was under the extinction threshold, although not massively so [10]. By the 2005 survey, its situation had improved, and the church was just on the extinction threshold [11]. That is, the Church of England was just avoiding future extinction. Unfortunately, there have been no more attendance surveys since. So, no further results can be obtained from this source.
Analysis of Church of England Attendance 2001-2011
The Data
Since 2001 the Church of England has been reporting its own attendance figures. These cannot be compared with the figures of Christian Research because they use different methodologies. However, the data can be used to assess the extinction/survival status since 2001. The most recent data is for 2011 [12]. Additional data sources, such as birth rates etc., are used to estimate several model parameters [13].
The data used is the combined all-age Sunday and weekday attendance [12, table 4]. Weekday attendance at churches has been growing, perhaps due to an ageing population. Also, churches being more willing to diversify in their approach to reaching communities. It has now become sufficiently large that it cannot be ignored. The church quotes the highest, average and lowest figures. The average has been used. Because the Limited Enthusiasm model interprets changes over time, it is not critical which of the three data sets are used. What is important is that they have been consistently measured each year.
Data Fitting
The best fit between the model and data gives a value for the reproduction potential and the two thresholds. Many such “best fits” are obtained by modifying other parameter values [14]. The majority of best fits, 66%, indicate that the church will avoid extinction. However, there is no convincing sign that there is any underlying revival growth. The most likely scenario is that the Church of England will survive, but at a significantly reduced level.
It may be helpful to compare a typical pessimistic data fit, where the Church of England eventually becomes extinct, with an optimistic fit, where the church survives. Figure 1 compares two such fits with the data [15]. There is little to choose between them on the basis of the data from 2001 to 2011. However, extrapolating from 2012 onwards, the optimistic scenario shows increasing signs of a slowdown in decline. The predicted difference by 2020 is quite significant.

On the basis of attendance figures alone, it is not possible to distinguish between pessimistic and optimistic fits. To draw a clearer conclusion, additional information is required, such as the number of enthusiasts. This is a difficult number to measure. However, evidence for the effect of enthusiasts, could be obtained from the use of the things like the Alpha course, community engagement or prayer meetings. These would hel give more confidence in one scenario over the other.
Extrapolation
The two scenarios can be extrapolated further into the future, assuming enthusiasts remain at the same effectiveness. The top graph of figure 2 gives church attendance. The pessimistic fit shows a decline at the same rate to almost 2040. However, the optimistic fit suggests that the church will start growing again after 2035. This is due to a recovery in enthusiasts, as seen in the bottom graph of figure 2. In the optimistic scenario, the number of enthusiasts will start increasing again nationally after 2020. This is enough for the church to avoid extinction and dropping below an attendance of 800,000. But, it is not enough for it to return to the 2001 figure.
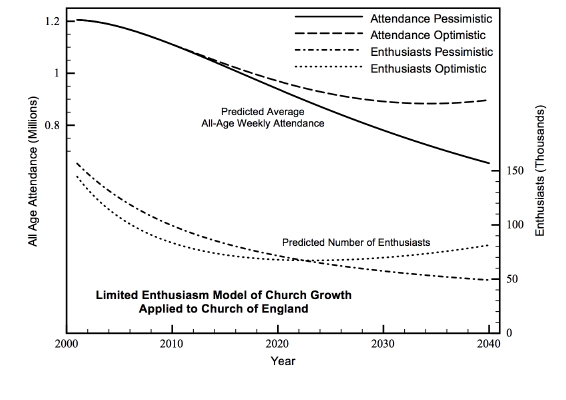
As optimistic scenarios were the more common of the data fits, then there is some confidence that the Church of England may not be declining so much as to become extinct and will see a small recovery in the next 20 years.
Conditions
There are a number of conditions that must be applied to this result.
- The church has an increasingly older age profile than society, thus the death rate of its attenders will increase over time. Thus recovery would take longer. The above scenarios in the previous graph are not predictions for actual numbers but an indication that the Church of England is most likely above the extinction threshold.
- The model aggregates together congregations that are dying through ageing, perhaps the majority, with a smaller number of growing and healthy congregations where most of the enthusiasts are based. In that case, the underlying growth in enthusiasts would be underestimated, and the reproduction potential of the enthusiasts should be higher. Thus the church would be more likely to see a future recovery. Such a recovery would involve churches with enthusiasts re-starting congregations in redundant parishes so that new pools of unbelievers can be tapped.
- The birth rate has been assumed to remain constant. It has increased recently in the UK, and this may make future growth in the church a little easier.
- Migration has been assumed constant. It has had a large impact on Pentecostal and independent churches in London, but it is doubtful if it has had much impact on the Church of England nationally. Migration may fall in the future. There, again, it may increase.
Strategies to Improve Church of England’s Attendance
If the Limited Enthusiasm Model is correct, then strategies that improve the number and the quality of enthusiasts are the keys to church growth. Such improvement can come through spiritual renewal, mission training, discipleship, community contacts and outpourings of the Holy Spirit. It is not a question of choosing one over the other but of using all. For many churches, it can start with a change of awareness that the individual members of a congregation are as important to its growth as its leaders and that each person needs to embrace that responsibility.
In addition, the thresholds of extinction and revival growth can be lowered by improving the retention of adults and children in the church. Widening the contact between a church and its community will further lower the revival-growth threshold, making rapid growth more likely. A combined policy of improving enthusiasts, stemming losses, and increasing community contacts can make the difference between extinction and revival [10].
Although the Church of England is declining and will do so for some time, there is evidence that its ability to avoid extinction is improving. If it continues to apply policies to generate enthusiasts and retain people and makes those policies more widespread, it is very possible that sustained decline can be turned into sustained growth. Although this research cannot be used to predict actual numbers, I hope it will be used to give encouragement to the Church that it can survive and turn decline back into growth.
I have posted an update on these results for the 2012 data
Decline of the Church of England – Update 2001-2012
References and Notes
[1] Brierley P. Religious Trends 2000/2001, no.2. Table 2.12, page 2.12, Christian Research. There is no reliable measure of attendance for most Christian denominations spanning 1900-2000. Thus, membership is the best indicator of church growth and decline for this period.
[2] Brierley P. UK Church Statistics 2005-2015, table 1.1.1 page 1.1, Brierley Consultancy.
[3] Brierley P. Religious Trends 2000/2001, no.2. Table 8.2.1, page 8.2, Christian Research.
[4] Brierley P. UK Church Statistics 2005-2015, table 2.1.2 page 2.1, Brierley Consultancy.
[5] McGuinness F. Membership of UK Political Parties, Research Briefing, Standard Notes SN/SG/5125, House of Commons, London, UK, 2012. No longer available. Instead, see the 2022 Version.
[6] New Statesman, July 30, 2012, How Tory Membership has Collapsed under Cameron [last accessed 1/12/2022]
[7] The Limited Enthusiasm Model is explained on the Church Growth Modelling website at: Limited Enthusiasm Model . The model was proposed in the publications:
- A General Model of Church Growth and Decline. Journal of Mathematical Sociology, 29(3), 177-207, 2005.
- Mathematical Modeling of Church Growth, Journal of Mathematical Sociology. 23(4), 255-292, 1999
l[8] In epidemiology, the reproduction potential is called R0, the basic reproductive ratio, or basic reproduction number. See Basic Reproduction Number on Wikipedia, [last accessed 1/12/22]. The limited enthusiasm principle is similar to the spread of a disease. In this case, the disease is religion, as measured by church membership or attendance.
[9] Brierley P. (2006) Pulling Out of the Nosedive – What the 2005 English Church Census Reveals, Christian Research. Brierley P. (2000), The Tide is Running Out – What the English Church Census Reveals, Christian Research. Brierley P. (1991), Christian England – What the English Church Census Reveals, Christian Research.
[10] Hayward J. (2005) A General Model of Church Growth and Decline, Journal of Mathematical Sociology, 29(3), pp.177-207.
[11] As I reported in “Challenge to Change: exploring strategies for an effective Church in a post-Christian landscape”, June 2009. http://www.churchmodel.org.uk/glam.pdf
[12] Statistics for Mission 2011, Church of England. No longer available on their website (2022).
[13] A number of parameters in the model needed to be estimated from sources other than the attendance data. Birth and death rates are taken from recent figures published by the Office for National Statistics (ONS). Migration is added to the birth rate. Average figures are taken. The reversion rate is estimated at 5% per year, typical of figures that were obtained by data fitting with other churches [10]. It should be noted that small variations in this figure have little effect on the likelihood of extinction or survival.
Retention of children born to church members is taken as 30%. This figure is based on religious transmission rates for Christianity given as a comparison with Islam in “Intergenerational Transmission of Islam in England and Wales: Evidence from the Citizenship Survey”, Scourfield J., Taylor C., Moore G., and Gilliat-Ray S., Sociology, 46(1): 91-108. For a summary, see: Muslims pass on faith to children at higher rates than Christians
The average time taken for a leaver to be open to returning to church again was taken as 20 years. This figure is based on a past survey where only 20% of those who leave church return after an average of 10 years. [9, The Tide is Running Out, p.84]
[14] Estimates of initial numbers for 2001 need some care. Although the total population and the numbers of believers are known (ONS and [12] respectively), it is not possible to even guess the fraction of the church who are enthusiasts or the fraction of unbelievers who are hardened. Instead, many simulations are run with various values and best fits obtained for each. The number in the hardened group is assumed not to change dramatically during the period.
Tags: Church of England, Church Statistics, Enthusiasts, Extinction, Survival
In March 2014 the Church of England released data for 2012, and at the same time revised previous estimates. A new measure has been introduced called the worshipping community. The revised measure should not affect the above analysis much, as the data fitting only requires consistency in the measure in each year used, whatever the measure is. The C of E has also given estimates of people leaving and of deaths. This could well change the estimates of the reproduction of enthusiasts and thus whether the church is under the extinction threshold. The revision has now been posted. http://churchgrowthmodelling.blogspot.co.uk/2014/09/decline-of-church-of-england-update.html
This comment has been removed by the author.
'4. Migration has been assumed constant. Migration has had a large impact on Pentecostal and independent churches in London, but it is doubtful if it has had much impact on the Church of England nationally.'
I'm not sure if this is exactly true. In many multicultural cities you will find multicultural congregations in mainstream churches, and it has been noted that in some areas, these churches would have been at risk of closure far sooner if it hadn't been for the influx of Caribbean immigrants in the 1950s and 1960s. I also read recently that one of the country's most prominent black Anglican congregations is in Birmingham, not in London. However, it's obviously true that London is important for ethnic minority churchgoers, simply because that's where most people from ethnic minorities live.
If you're talking about immigration at the turn of this century, then it's likely that new immigrants no longer have to try out the indigenous denominations, but can go straight to the churches that have been set up by previous incomers. But some may still prefer to attend the historical churches if they grew up with them. Moreover, these churches are probably more welcoming in Britain today than they were in the 1950s.
Interestingly, 'The Tide Is Running Out' by Peter Brierley notes that the number of black churchgoing Anglicans almost doubled between 1992 and 1998, despite a general decrease in Anglican attendance by 16% (p. 135-136). We know that immigration has increased rapidly since then, and at least some of the Christians among the cohort are likely to have ended up in an Anglican church, whether in London or in other increasingly multicultural cities.
Hi. Thank you for your comments. If I had been modelling the London Anglican scene alone then I would need details on migration figures. Clearly important and not constant. I would also need details on age profile of migrants as this will effect birth and death rates. It is for that reason I usually only apply my models to the national figures where such irregularities are smoothed out. Sadly the growth of the London diocese is swamped out by the overall decline at present. If estimates of migration in London Anglican churches become available I may have a go at modelling this in the future. Of particular interest to me is migrants as a source of enthusiasts. Thank you
A quick google shows that London's age profile is younger than that of the rest of the country, and that immigration is particularly relevant to the demographics. I don't know how this would relate to the CofE in particular, but in England nearly 60% of all churchgoers in their twenties go to church in London, according to P. Brierley. The CofE has more churches in London than any other single denomination, so further research might show that like other denominations it benefits from the multicultural presence of young people.
Regarding migrants as a source of enthusiasts, my interest is in the African-Caribbean churches that were established in Britain in the 50s and 60s, mostly as plants of Pentecostal and other denominations, and later went through a rapid period of growth. Many of the migrants recruited had attended the historical churches in the Caribbean but had previously given up on churchgoing on setting in Britain. In many cases the AC churches are now experiencing a loss of 'enthusiasm' and of members as circumstances have changed, although some denominations – e.g. the New Testament Church of God and the Seventh Day Adventists – are still experiencing growth. The African churches are mostly newer and have grown rapidly in recent decades.
Whether the white population has ever been or will ever be significantly attracted to black majority churches is a question that deserves its a lengthy study of its own, but we mostly have to make do with passing references, anecdotes, comments about African 'reverse missionaries' and claims that 'black churches' are in fact open to 'whomsoever will'. Some black churches have deliberately tried to engage in mission to white people, but it would appear to be a problematic endeavour for various reasons.
Thank you for your comments. Very relevant stuff.
London is indeed younger than the rest of the UK. It could be argued that younger people have more enthusiasm as their views are in a formative stage. Perhaps more importantly they have more volatile contact, thus it is more likely they will be able to pass on their beliefs to someone else. Older people, especially in rural areas have very static networks of contacts. They meet few new people so less people to be influenced.
Immigration also stirs up the network of contacts, making faith transmission higher. Added to that they are looking for a foothold in a new country then church is an ideal place to go.
I suspect that both of those are more than sufficient to tip the Anglican church in London into growth mode. So if there is a move of the Spirit among people, then revival growth is more likely to occur.
I think you comments about the older Afro-Caribbean are probably true. Unless they have changed in style they might find it as hard to pass on to the next generation as the older denominations of Methodist etc. Churches are not good at passing the faith to the next generation and giving them the space to lead their own church or movement.
White people at BMEs. I have been told by some of my students that this does happen in Birmingham. What started as a BME had become genuinely multiracial, but I have no first hand experience of its extent, or whether this happens in other cities. The sort of thing someone may have done some research in.
Cross-cultural mission is hard. It can be as hard to change culture as change beliefs. There are two conversions, one to Christ and one to church culture! Sadly many older denominations seem to be caught in a permanent time warp especially with music, dress, style of buildings, and just do not seem to be able to deal with it despite their decline and predicted extinction. I suspect many BMEs will have the same difficulty with their cultures.